Iostat
Christian Külker
0.1.3
2024-03-05
Introduction
The iostat command, a critical component of the sysstat package, is instrumental in reporting CPU utilization alongside disk I/O statistics. For a comprehensive understanding of the suite of tools included in the sysstat package, please refer to the Sysstat documentation. To ensure the proper functioning of iostat, it is imperative that the /proc file-system be mounted. It is noteworthy that iostat is compatible with Linux kernels version 2.6.x and above, as support for older versions has been discontinued.
An important clarification regarding the terminology used by iostat is its reference to data measurement units. While terms like kilobytes (kB) and megabytes (MB) are commonly used, iostat actually employs kibibytes (kiB) and mebibytes (MiB), respectively. A kibibyte is equivalent to 1024 bytes, and similarly, a mebibyte corresponds to 1024 kibibytes. This distinction is crucial for accurate data interpretation and system analysis.
Installation
aptitude install sysstatUsage
The simplest way to utilize iostat is by executing the command without any additional parameters. Simply typing iostat in the command line provides a quick snapshot of the system’s I/O statistics. To illustrate the versatility and the range of information that iostat can offer, this section presents five distinct output examples. Each example is derived from different machines, showcasing how iostat adapts to various system environments and configurations.
Example 1:
An older server in 2020 with a software RAID produced this output:
iostat
Linux 4.19.0-12-amd64 (smtp)   03/12/20   _x86_64_  (2 CPU)

avg-cpu:  %user   %nice %system %iowait  %steal   %idle
           0.60    0.00    0.33    0.81    0.00   98.26

Device             tps    kB_read/s    kB_wrtn/s    kB_read    kB_wrtn
sdb               4.48        23.13        49.63     454297     974773
sda               8.33        83.12        22.94    1632542     450485
md0               0.02         0.30         0.00       5901         28
md1               9.58        78.69        21.76    1545389     427308
Example 2:
Newer version (on an old machine) also include dm devices (in color) on Debian 12 Bookworm:
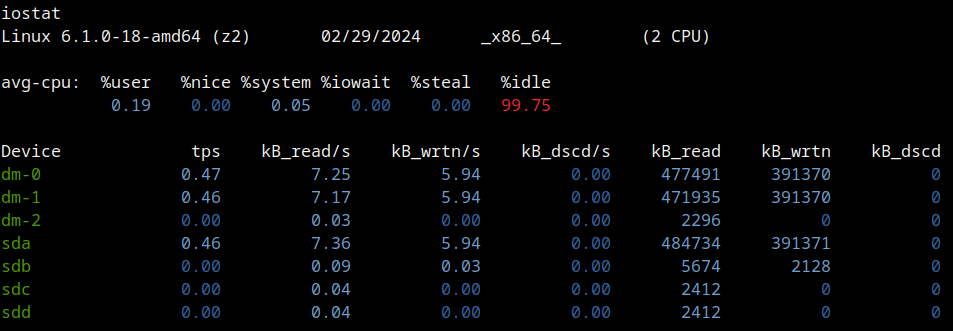
Example 3:
iostat
Linux 6.1.0-18-amd64 (host)   02/29/2024   _x86_64_  (4 CPU)

avg-cpu: %user   %nice %system %iowait  %steal   %idle
         18.52    0.00    6.39    0.03    0.00   75.06

Device  tps  kB_read/s  kB_wrtn/s  kB_dscd/s   kB_read    kB_wrtn    kB_dscd
dm-0   6.22       9.11     253.99      14.61   6385739  177975346   10235216
dm-1   6.15       9.05     253.99      14.61   6343319  177975346   10235216
dm-2   0.00       0.00       0.00       0.00      2296          0          0
dm-3   0.23       5.00       0.42       0.00   3504132     293592          0
dm-4   0.23       4.94       0.42       0.00   3463460     293592          0
dm-5   0.00       0.00       0.00       0.00      1044          0          0
sda    0.00       0.01       0.00       0.00      3808          0          0
sdb    6.08       9.12     253.99      15.07   6393024  177975349   10560917
sdc    0.22       5.01       0.42       0.00   3512376     293592          0
Example 4:
iostat
Linux 6.1.0-18-amd64 (host)   02/29/2024   _x86_64_  (4 CPU)

avg-cpu:  %user   %nice %system %iowait  %steal   %idle
           0.23    0.00    0.11    0.01    0.00   99.65

Device   tps  kB_read/s  kB_wrtn/s  kB_dscd/s    kB_read    kB_wrtn    kB_dscd
dm-0    1.31      20.03      16.90       0.00    1793052    1512546          0
dm-1    1.30      19.95      16.90       0.00    1785960    1512546          0
dm-2    0.00       0.03       0.00       0.00       2296          0          0
nvme0n1 0.01       0.17       0.00       0.00      15358          1          0
sda     1.28      20.15      16.90       0.00    1803734    1512548          0
Example 5:
On Debian 11 Bullseye a Raspberry PI 4 with 8GB RAM:
Linux 5.10.0-28-arm64 (host)   02/29/2024   _aarch64_  (4 CPU)

avg-cpu:  %user   %nice %system %iowait  %steal   %idle
           0.73    0.00    0.38    0.01    0.00   98.89

Device   tps  kB_read/s  kB_wrtn/s  kB_dscd/s    kB_read    kB_wrtn    kB_dscd
sda     0.64       1.21       6.72     105.79    1605164    8941067  140663032
Reports
The iostat command methodically generates two pivotal reports that are essential for a comprehensive analysis of system performance:
CPU Utilization Report (with the parameter
-c): This report describes the CPU usage patterns. It gives details about system, user, iowait, and idle distribution of CPU usage. By analyzing this data, one can pinpoint CPU performance bottlenecks, understand load distribution, and optimize the computational efficiency of the system.Device Utilization Report (with the parameter
-d): The second report focuses on the behavior of storage devices. It gives metrics such as the number of reads and writes per second, the amount of data transferred, and the overall throughput of the device. This report is useful for diagnosing I/O performance issues, planning capacity after real world tests, and ensuring the storage subsystems are operating within their parameters.
For a more granular understanding of these reports, reported values and units, the iostat manual page provides exhaustive documentation.
Medium Usage
Print device partition information:
Loop back devices with no activity can be skipped with -z.
iostat -p ALL
Linux 6.1.0-18-amd64 (host)   02/29/2024   _x86_64_  (4 CPU)

avg-cpu:  %user   %nice %system %iowait  %steal   %idle
           0.27    0.00    0.13    0.01    0.00   99.58

Device     tps  kB_read/s  kB_wrtn/s  kB_dscd/s  kB_read    kB_wrtn    kB_dscd
sda       1.29      20.01      17.55       0.00  1803754    1582595          0
sda1      0.00       0.03       0.00       0.00     2344          0          0
sda2      0.00       0.06       0.00       0.00     5638          2          0
sda3      1.28      19.90      17.55       0.00  1793808    1582593          0
nvme0n1   0.01       0.17       0.00       0.00    15358          1          0
nvme0n1p1 0.00       0.08       0.00       0.00     7285          1          0
nvme0n1p2 0.00       0.01       0.00       0.00      840          0          0
nvme0n1p3 0.00       0.03       0.00       0.00     2373          0          0
nvme0n1p4 0.00       0.03       0.00       0.00     2344          0          0
dm-0      1.31      19.89      17.55       0.00  1793072    1582593          0
dm-1      1.30      19.81      17.55       0.00  1785980    1582593          0
dm-2      0.00       0.03       0.00       0.00     2296          0          0
loop0     0.00       0.00       0.00       0.00        0          0          0
loop1     0.00       0.00       0.00       0.00        0          0          0
loop2     0.00       0.00       0.00       0.00        0          0          0
loop3     0.00       0.00       0.00       0.00        0          0          0
loop4     0.00       0.00       0.00       0.00        0          0          0
loop5     0.00       0.00       0.00       0.00        0          0          0
loop6     0.00       0.00       0.00       0.00        0          0          0
loop7     0.00       0.00       0.00       0.00        0          0          0
Short Reports:
Print the 80 columns short version (in contrast to the extended version with -x)
iostat -s
Linux 6.1.0-18-amd64 (host)   02/29/2024   _x86_64_  (4 CPU)

avg-cpu:  %user   %nice %system %iowait  %steal   %idle
           0.29    0.00    0.14    0.01    0.00   99.56

Device             tps    kB_read/s     kB_w+d/s    kB_read     kB_w+d
dm-0              1.31        19.84        17.53    1793072    1584954
dm-1              1.30        19.76        17.53    1785980    1584954
dm-2              0.00         0.03         0.00       2296          0
nvme0n1           0.01         0.17         0.00      15358          1
sda               1.28        19.96        17.53    1803754    1584956
Collaboration With Other Linux Commands:
Simple evocation of iostat can be combined with the watch command to constantly monitor one or more devices every 2 seconds (default value of watch), in short form for example.
watch iostat -dsMonitoring Disk Utilization in Real-Time with Specific Intervals and Counts:
To continuously monitor disk I/O and CPU statistics in real time, iostat can be run with specified intervals and counts. For example, iostat -dx 5 6 will display detailed disk statistics (-d for disk, -x for extended metrics) every 5 seconds, and repeat this process 6 times. This is particularly useful for observing system behavior under varying loads or for short-term performance testing.
iostat 2          # Execute iostat every 2 seconds
iostat 2 4        # Execute every 2 seconds, 4 times in total
iostat -x sda 2 4 # Exectute every 2 seconds, 4 times, for /dev/sda
Advanced Usage
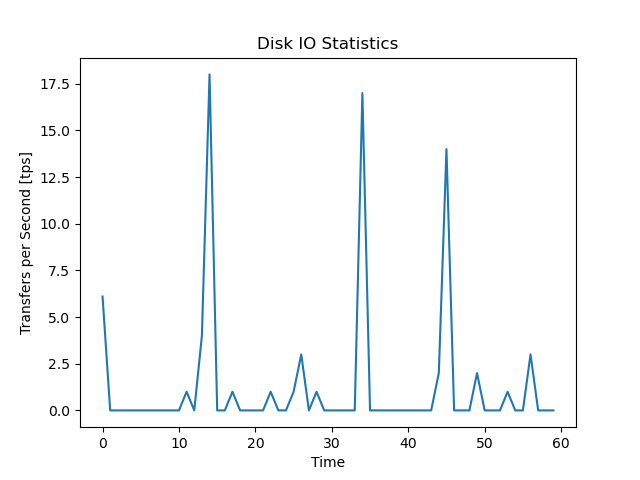
The first column, labeled tps, represents the number of transfers issued to the device per second. Essentially, a transfer is an I/O request to the device. It’s important to note that multiple logical requests may be merged into a single I/O request. The size of each transfer is not fixed, varying based on the nature and requirements of the requests.
iostat -d 1 60
Device   tps  kB_read/s  kB_wrtn/s  kB_dscd/s  kB_read  kB_wrtn  kB_dscd
sdb     7.00       0.00      25.50       0.00        0       25        0
The following Python script capture the tps from /dev/sdb/ for 1 minute with the resolution of 1 second.
import subprocess
import matplotlib.pyplot as plt

# Run iostat and capture its output
output = subprocess.check_output(["iostat", "-d", "1", "60"]).decode()

# Parse iostat output to extract disk io stats
lines = output.splitlines()
io_stats = [float(line.split()[1]) for line in lines if "sdb" in line]

# Plotting the disk io stats
plt.plot(io_stats)
plt.title('Disk IO Statistics')
plt.xlabel('Time [sec]')
plt.ylabel('Transfers per Second [tps]')
plt.show()
The output is a PNG graph on screen and can be saved.
Similar statistics can be collected with the JSON interface of iostat. Just for the sake of doing something different the following Perl script uses GnuPlot and ImageMagic. For this to work Chart::Gnuplot needs to be installed.
aptitude install libchart-gnuplot-perlThis will install at least
- aglfn
- gnuplot-data
- gnuplot-nox
- groff
- libchart-gnuplot-perl
- psutils
In addition ImageMagic has to be configured to read and write Postscript. Edit the file /etc/ImageMagick-6/policy.xml and change the line <policy domain="coder" rights="none" pattern="PS" /> to <policy domain="coder" rights="read|write" pattern="PS" />
use strict;
use warnings;
use JSON;
use Chart::Gnuplot;

my $json_text = qx(iostat -d -o JSON sdb 1 60);

my @io_stats = map { $_->{'disk'}[0]{'tps'} }
   @{ decode_json($json_text)->{'sysstat'}{'hosts'}[0]{'statistics'} };

my $chart = Chart::Gnuplot->new(
    output => "iostat-tps-json-gnuplot-0.1.0.png",
    title  => "Disk IO Statistics",
    xlabel => "Time [sec]",
    ylabel => "Transfers per Second [tps]",
    bg => 'white',
    yrange => [ -1, "*" ],
);

my $dataSet = Chart::Gnuplot::DataSet->new(
    ydata => \@io_stats,
    title => "sdb",
    style => "lines",
    width => 5,
);

$chart->plot2d($dataSet);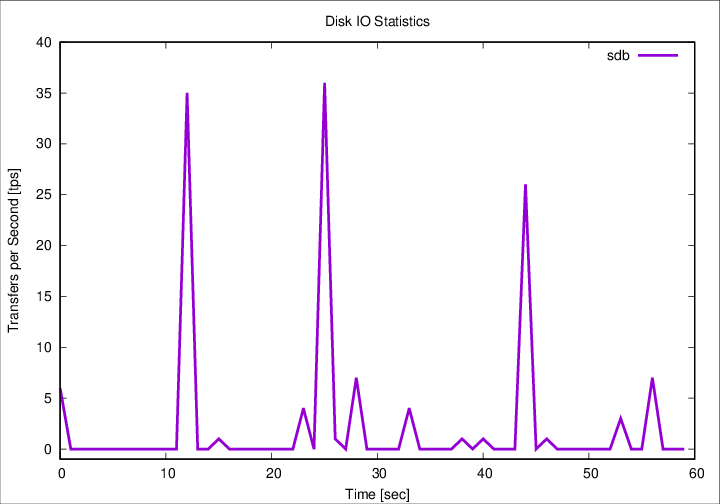
Links
- Home page https://sysstat.github.io/
- Source https://github.com/sysstat/sysstat
- Discontinued home page http://sebastien.godard.pagesperso-orange.fr/
- mpstat
History
| Version | Date | Notes |
|---|---|---|
| 0.1.3 | 2024-03-05 | Add link to mpstat |
| 0.1.2 | 2024-03-01 | Fix link, mv, improve script, add JSON Perl script |
| 0.1.1 | 2024-02-29 | Advanced example, more outputs |
| 0.1.0 | 2021-05-13 | Initial release |
- Last modified (via git): March 05, 2024
- Add link to mpstat (860df87f)
- 1478 words
- PDF 🡺
- PDF 🡻